

AI Automation Reliability: How Reliable Is a Multi-Step LLM Workflow?
End-to-end reliability for multi-step LLM automation: TAARM v1.0 on success contracts, serial products, retries, Monte Carlo, and an open validation package.
· TankDev Mühendislik
Automation reliability is not the accuracy of the language model in isolation. It is the probability that a defined business task completes correctly, from intake through a validated, recorded outcome. When LLM calls, APIs, database operations, and image generation form one workflow, every dependency can affect that outcome.
TankDev AI Automation Reliability Model (TAARM) v1.0 is an open calculation model for investigating this relationship. It estimates success probability, expected attempts, and execution spend for serial, parallel-all, conditional, and ordered fallback compositions. Seeded Monte Carlo simulation checks the same assumptions at execution level. This is not an industry standard, certification, or provider performance score. The probability rules are established mathematics; TankDev’s contribution is the explicit execution contract, tool, and reproducible validation package that bring them together.
1. Define the success contract first
Consider a workflow that reads a customer request, extracts structured data, retrieves product information, creates a quote, generates an image, and stores the result. HTTP 200 and valid JSON do not prove completion. The product code may be wrong, the price stale, or the quote attached to the wrong customer while the technical response appears successful.
- Transport success: Did the request return within its timeout?
- Structural validity: Does the output conform to the required schema?
- Semantic correctness: Do the fields agree with the source and business rules?
- Side-effect correctness: Was the intended record created exactly once?
- Completion criteria: Are all required outputs and checks present?
The input p in TAARM describes an attempt whose success has been defined accordingly. The model does not separately estimate false acceptance. If your validator checks JSON structure alone, you cannot call p “business correctness.” Human review, deterministic checks, and representative labeled examples belong in that measurement. v1.0 also does not impose a global completion deadline: its simulated latency percentiles are not an SLA for correct, on-time delivery.
Make success an auditable business outcome
Use a B2B quotation workflow as the running example. Its success contract requires the request to belong to the correct customer, product and pricing data to be verified against current sources, mandatory quote outputs to be produced, and the quote to be stored as one record. Production may add a five-minute completion deadline. The calculator's success metric does not enforce that deadline, so correct completion and correct, on-time completion need separate measurements.
Suppose 970 of 1,000 starts reach “completed,” but an audit finds the wrong currency in 20 of those quotes. Verified business success is 950/1,000 = 95%, not 970/1,000. Validator acceptance is 97%. A dashboard that hides this difference can show healthy automation while customers receive incorrect quotes. Sample accepted outputs as well as recorded failures to measure actual correctness.
2. A simple example: why 98.5% may not be enough
The default example contains 8 LLM calls, 3 API calls, 2 database operations, and 1 image generation: 14 serial steps. Assume each step succeeds independently with probability 98.5% on one attempt, with no persistent failures or shared preflight failures. End-to-end success is 0.985 to the power of 14, approximately 80.93%. That is roughly 1,907 expected failures per 10,000 workflow starts. These are illustrative calculations, not live provider measurements.
R_serial = product(R_i)
R_example = 0.985^14 ≈ 0.8093
Expected failures = N × (1 − R_workflow)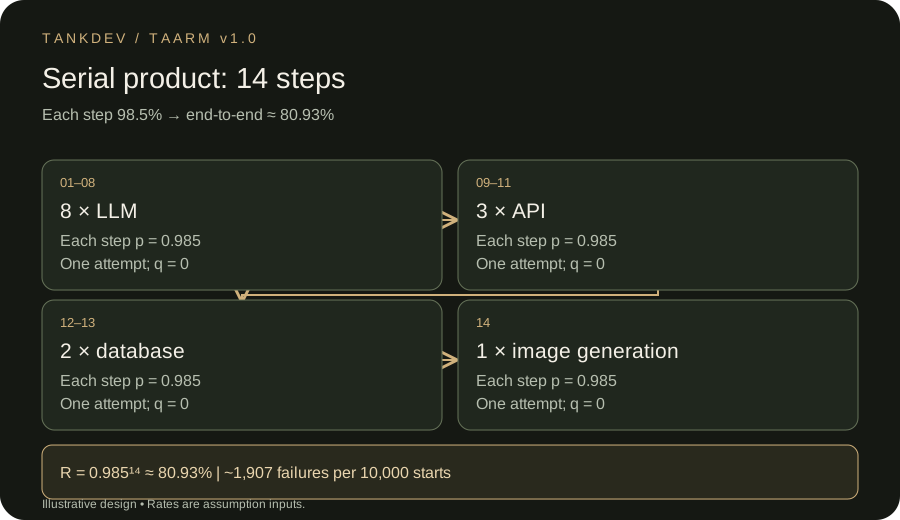
Multiplication requires the appropriate independence assumptions. Missing information in one document may affect every LLM step, and an incorrect API result may contaminate downstream decisions. NIST’s series model likewise states independence and first-component-failure assumptions; here we apply the corresponding probability logic to finite workflow events.
One baseline, three different engineering decisions
Giving every step the same probability makes the mathematics visible. A PostgreSQL write and an image-generation operation do not, in practice, share identical correctness, failure, or cost profiles. These defaults are neither provider recommendations nor industry averages.
Moving from one to two total attempts per step reduces expected failures from about 1,907 to 31 per 10,000 starts when q=0. With a 1% persistent-failure probability at every step, the same policy leaves about 1,340 failures. With q=0 but a 2% shared preflight failure, the two-attempt design reaches only about 97.69%. “We added retries” is incomplete: the error class being retried determines the benefit.
A 99.5% success target allows 50 failures per 10,000 starts. The independent two-attempt scenario appears to fit that budget; the persistent-failure and preflight scenarios do not. This is a design screening exercise. A production commitment requires validating the assumptions against observed executions.
3. The node model: separate transient and persistent failure
For an operation node, p is the probability of validated success on an attempt conditional on the node not entering its persistent-failure state. q is the probability that, when reached in this run, the node enters a state that causes all its attempts to fail. a is the maximum number of attempts, including the first. Two retries mean three total attempts; the interface requests total attempts.
| Symbol | Meaning | Boundary |
|---|---|---|
| p | Attempt success outside persistent state | 0 ≤ p ≤ 1 |
| q | Persistent state probability when the node is reached | 0 ≤ q ≤ 1 |
| a | Total attempt budget, including the first | 1–10 |
| g | Shared abort before any node executes | 0 ≤ g ≤ 1 |
| b | Probability of choosing the first conditional branch | 0 ≤ b ≤ 1 |
| C | Expected cost including failed starts | C ≥ 0 |
Without the persistent state, attempts are independent with fixed p. In the persistent state, v1.0 consumes the selected attempt budget; it does not model early recognition of a permanent error. Persistent failures therefore increase retry cost as well. First-attempt success is (1−q)p. Entering an observed overall success rate as p and then adding q can count the same failure twice.
R_step = (1 − q) × [1 − (1 − p)^a]
E[attempts | reached] = q × a + (1 − q) × sum(k=0..a−1, (1 − p)^k)
E[cost | reached] = cost_per_attempt × E[attempts | reached]
With p=0.985, q=0, and a=2, node success becomes 99.9775%, taking the 14-step serial workflow to approximately 99.6855%. But with q=1% at every node, the same retry policy yields approximately 86.60% end-to-end success. More retries cannot manufacture missing source information or grant an absent permission.
Classify retriable failures in production. Retrying writes without idempotency and outcome verification can create duplicates. A timeout does not prove that the remote operation did not happen. AWS’s guide to timeouts, retries, and backoff addresses these operational risks. TAARM does not model retry storms or the reduction in p caused by increased traffic.
A quick check on p and q
Let p=0.90, q=0.05, and a=2. Overall first-attempt success is 85.5%; success within two attempts is 94.05%. Expected attempts are 0.05×2 + 0.95×(1+0.10) = 1.145. As a grows without bound, success approaches 1−q = 95% when p>0. Repeatedly submitting a document does not create its missing customer identifier.
“Persistent” means persistent across this run's attempts using the same strategy, not impossible to resolve forever. Asking the customer for missing information or switching to a different document parser creates another execution path. Model that as fallback or human intervention rather than independent retries with a fixed p.
4. Serial, parallel, conditional, and fallback are different contracts
A serial group runs children in order and stops on the first failure. With R denoting success and C expected cost, each child’s cost is weighted by its probability of being reached. A 14-step workflow does not necessarily make 14 calls on every start.
R_serial = product(R_i)
E[C_serial] = sum(i, C_i × product(j<i, R_j))
R_parallel_all = product(R_i)
E[C_parallel_all] = sum(C_i)
R_conditional = b × R_A + (1 − b) × R_B
E[C_conditional] = b × C_A + (1 − b) × C_B
R_fallback = 1 − product(1 − R_i)
E[C_fallback] = sum(i, C_i × product(j<i, 1 − R_j))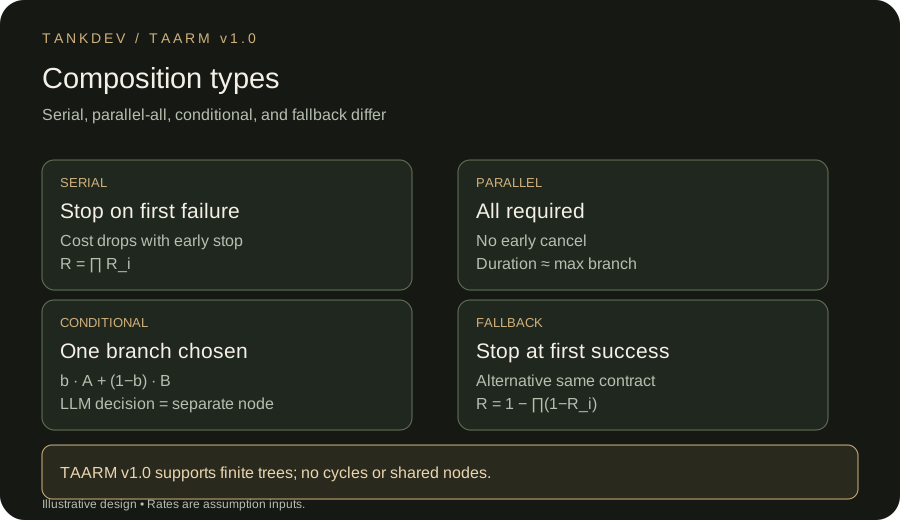
In parallel-all, every child starts and every child must succeed. There is no early cancellation. Reliability has the same formula as serial composition under independence, but cost and latency differ. Do not confuse this execution topology with the “at least one succeeds” redundancy model in reliability literature.
A conditional group selects A with probability b and B otherwise; it does not execute both. Selection in v1.0 is free and independent of branch outcomes. If an LLM makes the routing decision, add that call as a separate preceding node. If 30% of traffic consists of difficult documents, estimate that branch’s p values from that document population.
Fallback tries alternatives in order and stops at the first validated success. A second provider failing on the same malformed input weakens the independence assumption. Alternatives must also satisfy the same success contract: replacing a required image with text is not success unless the contract permits it. Groups can be nested; v1.0 supports finite trees rather than loops, shared nodes, or arbitrary DAGs.
Calculate the cost difference with two operations
Let A succeed with probability 90% and cost 1 unit per attempt; let B succeed with probability 80% and cost 2 units. Use one attempt each and q=g=0. Serial execution succeeds with probability 72%, takes 1.9 expected attempts, and costs 1 + 0.9×2 = 2.8 units. B runs only after A succeeds. Parallel-all still succeeds with probability 72%, but takes two attempts and costs 3 units because both operations start.
If A and B are interchangeable ways to satisfy the same requirement, fallback succeeds with probability 1−0.1×0.2 = 98% and costs 1 + 0.1×2 = 1.2 units. Customer verification and payment collection are not interchangeable: making them fallback alternatives would break the business contract. Conditional routing sends 30% of traffic to A and 70% to B, yielding 83% success and 1.7 units of cost. These four calculations describe different jobs; their percentages alone do not rank architectures.
5. Shared failure: a ceiling retries cannot remove
The global input g is a shared preflight failure that aborts the run before any node executes—for example, a required access check failing at intake. Such a run records zero attempts, zero execution spend, and zero duration; additional failure loss still applies. This is not a model of a provider outage that begins mid-run.
R_workflow = (1 − g) × R_tree
E[C_workflow] = (1 − g) × E[C_tree]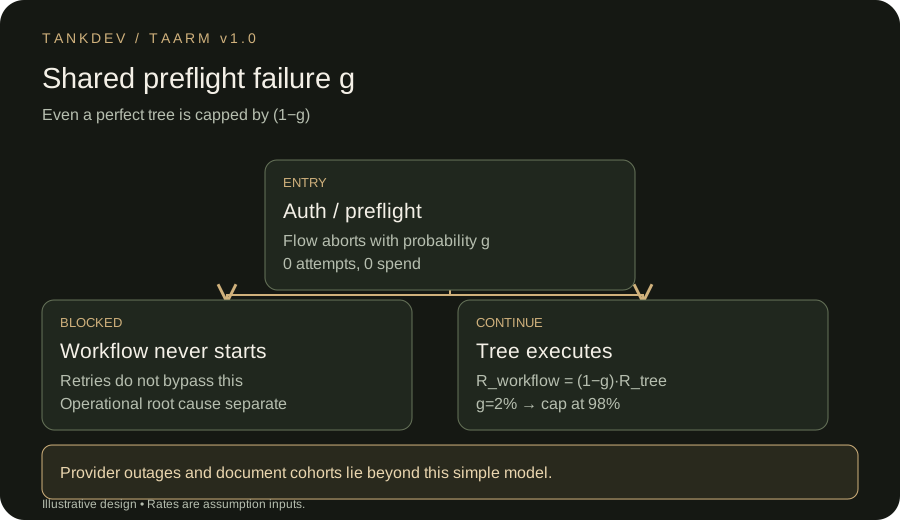
At g=2%, even a perfect tree cannot exceed 98% success. This simple common-failure model makes a dependency visible but does not represent all shared provider incidents, bad-document clusters, or time-varying outages. Other dependencies between nodes are outside v1.0. If they matter in your system, do not convert the calculator’s point estimate into a capacity or SLA commitment.
6. Read costs, call counts, and latency carefully
Expected attempts are averaged across every workflow start, including failures. External calls include LLM, API, and image attempts but exclude database operations. Cost per attempt is fixed, and failed attempts incur the same charge. Actual token lengths, cache discounts, tool fees, and provider billing rules require separate assessment.
Additional failure loss multiplies your loss per failed run by expected failed runs. It excludes execution spend. You might use this field for human correction effort; avoid counting the same effort again as a node cost. The model does not estimate revenue, profit, or return on investment.
Simulation assigns a fixed duration to every attempt and a fixed delay between retries. Serial and fallback durations add; parallel-all duration is the longest branch; conditional duration is the selected branch. p50 and p95 include successful and failed starts. Queueing, rate limits, jitter, variable token latency, human approval queues, and shared capacity are excluded. Under these assumptions, the duration outputs are not production latency benchmarks.
Budget the quotation workflow step by step
Consider four mandatory serial operations: extracting the request with an LLM (p=0.97; q=0.01; a=2; cost 0.02 units per attempt), reading a pricing API (0.995; 0.001; 2; 0.001), generating the quote document (0.98; 0.005; 2; 0.01), and writing the database record (0.999; 0; 1; 0.001). Set g=0. These are explicitly chosen illustrative inputs, not measurements from TankDev customer systems.
| Operation | p | q | a | Cost / attempt |
|---|---|---|---|---|
| Request extraction (LLM) | 0.97 | 0.01 | 2 | 0.02 |
| Pricing read (API) | 0.995 | 0.001 | 2 | 0.001 |
| Document generation (API) | 0.98 | 0.005 | 2 | 0.01 |
| Persist (database) | 0.999 | 0 | 1 | 0.001 |
The node success probabilities are 98.9109%, 99.8975%, 99.4602%, and 99.9%. Their product is approximately 98.18%. Expected execution spend is about 0.0329 units per start. Across 10,000 starts, this means approximately 182 failures and 329 units of execution spend. An additional correction loss of 10 units per failed run contributes about 1,822 units. All amounts use the same illustrative currency; they are not a price quotation.
Increasing the first LLM node's total attempts from two to three improves end-to-end success by only about 0.086 percentage points. Reducing that node's q from 1% to 0.2% by addressing missing input information improves it by about 0.793 percentage points. Input quality has a larger probability benefit than another retry in this example. Implementation costs can differ, so this is not, by itself, an investment decision.
To explore it in the calculator, open the small example, create four serial nodes, enter p/q as percentages, and set total attempts. The reproducibility package below includes the complete four-node JSON and comparison calculations. JSON download saves your own design inputs; retain the model version and measurement date with the decision record.
7. What does Monte Carlo validate?
The tool executes 100,000 virtual runs. For each run it samples the preflight state, persistent states of reached nodes, conditional routing, and independent attempt outcomes. The same seed, tree, and version produce the same result. Simulation runs in a browser worker without making requests to real providers.
A 95% Wilson interval accompanies the simulated success rate. It describes Monte Carlo sampling uncertainty with fixed input assumptions. It does not cover incorrectly estimated p or q, a faulty validator, or unmodeled dependencies. Running 100,000 virtual workflows is not observing 100,000 real jobs. NIST’s confidence-interval reference describes the Wilson interval used here.
Agreement between analytical and simulated results checks implementation consistency; it does not prove the model represents the world. Expected attempts and spend are calculated analytically. For parallel latency, the expected maximum is not generally the maximum of expected values, so we obtain duration percentiles from sampled executions.
8. The open validation package and the benchmark boundary
The v1.0 package contains eight synthetic scenarios covering serial, parallel-all, conditional, fallback, persistent failure, shared preflight failure, and nested workflows. Each runs 100,000 times with a fixed seed: 800,000 virtual executions in total. Additional tests cover probability boundaries at zero and one, attempt budgets, early-stop costs, and deterministic duration examples. These tests were actually executed; no experiment against live LLM providers was performed.
| Scenario | Analytic success | Simulation | Delta (pp) |
|---|---|---|---|
| 14 independent steps | 80.9296% | 80.7110% | -0.2186 |
| Serial group | 49.6000% | 49.2980% | -0.3020 |
| Parallel · all required | 49.6000% | 49.5860% | -0.0140 |
| Fallback | 99.6000% | 99.6120% | +0.0120 |
| Conditional branch | 64.7600% | 65.0460% | +0.2860 |
| Persistent failure q | 89.2800% | 89.2500% | -0.0300 |
| Preflight failure g | 89.6400% | 89.6060% | -0.0340 |
| Nested workflow | 57.1183% | 57.0410% | -0.0773 |
Raw validation output: validation.json. Source code and test commands are included in the reproducibility package below.
The validation table and downloadable JSON on this page show the executed test output. Model source, the test script, scenario inputs, and seeds are published. Distinguishing simulation from measurement is more valuable than suggesting false certainty. Claiming that “model X achieved Y% in TankDev’s benchmark” would require a live evaluation that this package does not contain.
Reproduce the results locally
Download the TAARM v1.0 reproducibility package. It contains model.ts, model.test.mjs, the browser worker, raw output for all eight scenarios, the four-step quotation example, and a SHA-256 file manifest. No external npm dependencies or provider keys are required. Extract the ZIP and run these commands from its directory with Node.js 24.19.0, the runtime used for this validation.
node model.test.mjs
node editorial.test.mjs
The first command reruns the eight synthetic scenarios and writes public/research/taarm-v1/validation.json. The second checks the article's numerical examples and verifies that the browser worker produces the same simulation results as the model source for matching inputs and seeds. Scenario seeds start at 20260921 and increase by one per scenario. Compare results using the same code, runtime, and inputs.
The table's delta is simulated minus analytical success, in percentage points. Having every scenario fall inside its 95% interval is not a test requirement; multiple comparisons can produce exceptions. Tests also check analytical identities and boundary cases. Agreement validates implementation consistency, not live provider performance. This revision changes the explanation and evidence package, not the equations: model version 1.0.0, editorial package revision 2.
9. Estimating p and q from a real automation
Freeze the success contract first, then stratify representative examples by document type, language, length, customer workflow, and failure class. Record model/version, prompt, validator, tool schema, and retry policy. Keep examples used for prompt tuning or training separate from the final evaluation set. An aggregate success rate cannot identify p and q separately; you need attempt histories and failure classification.
- Workflow record: run_id, scenario version, start time, anonymized input-stratum identity, business outcome, and human verification.
- Node record: node_id, attempt_index, provider/model_version, validation_version, error class, latency, token or operation cost, and idempotency key.
- Retry record: Was the same input retried, or did a changed prompt introduce a different strategy? The latter may not fit independent retries with a constant p.
- Data separation: Investigate persistently failing inputs separately from transient failures, and retain unsuccessful attempts in the dataset.
- Reporting: Publish the denominator, observation window, sample size, uncertainty, and failure examples alongside the success percentage.
For example, observing no failures in 200 verified real runs is not a 100% guarantee. A different document distribution or model version next month can also invalidate the estimate. Reliability monitoring should track errors missed by the validator and changes in the input population as well as aggregate success. Remove personal data and provider keys from shared evidence.
What a real benchmark must disclose
Before reporting “99% success” from a live evaluation, freeze sampling rules, data strata, the success rubric, and human adjudication procedures. Apply the same inputs to architectures being compared, and version changes to prompts, models, validators, and retry policies. This is a reporting template to fill in, not the output of a completed experiment.
experiment_id / observation_window / workflow_version
dataset_version / inclusion_rules / held_out_examples
success_contract / adjudication_method / completion_deadline
provider_and_model_versions / prompt_hash / validator_version
starts / verified_correct / accepted_but_incorrect / unresolved
attempts_by_error_class / cost_all_starts / latency_distribution
confidence_interval_method / excluded_cases_and_reasons
Observing only reached nodes creates selection effects. Requests reaching the last step in a serial workflow may be easier than requests rejected earlier. Interpret p relative to the population reaching that step. When dependencies matter, construct separate scenarios for input strata instead of relying on one aggregate product. Retrying with a changed prompt is also a different intervention from repeating an attempt at the same p.
Zero errors in 200 audited jobs does not establish 100% reliability: the lower bound of a two-sided 95% Wilson interval is approximately 98.12%. A large Monte Carlo sample cannot remove uncertainty from a small real dataset. Running optimistic, base, and pessimistic p/q scenarios separately reveals how sensitive the decision is to those inputs.
10. Turning the result into an architectural decision
The calculator’s single-node improvement potential is the end-to-end gain if that node had p=1 and q=0. The lowest p is not always the largest opportunity: a rarely reached conditional or fallback branch can have little effect. This metric is not root-cause diagnosis, an achievable improvement promise, or a cost-benefit ranking.
Use it to ask three questions: How many steps are truly mandatory? Which errors can be retried using the same strategy? Where is human review or an alternative business path required? Removing an unnecessary call, validating before a side effect, and separating an optional illustration from the quote’s core success contract are different decisions from increasing retries.
TankDev’s AI automation architecture guide explains how LLMs, validation, APIs, queues, and human approval fit together in production. TAARM is one decision-support component of that architecture. Real reliability comes from measured inputs, a sound success contract, safe side effects, and operational discipline.
From calculation to production controls
An accepted quote should not be marked complete until its required downstream handoff is safely resolved. A state flow can look like the example below. Persist error classes and attempt counters so a worker restart cannot silently reset the retry budget.
received → extracting → validating → ready_to_commit → completed
retriable_error → retry_scheduled → previous_step
missing_information → needs_review → corrected_input → validating
unknown_write_outcome → reconcile → completed | needs_review
After an API timeout, query the previous operation using its idempotency key before creating another quote. A transactional outbox stores the quote and the intent to send a downstream event in the same local database transaction, helping manage the gap between a committed record and a lost message. Delivery can still repeat; the receiver must deduplicate event IDs. An audit log should preserve which input, software version, and human decision produced the outcome.
Human review is not a perfectly reliable, zero-duration node. Reviewers have limited capacity, working hours, waiting times, and decision errors. TAARM v1.0 does not model queue capacity, so report the needs_review path separately from automatic completion. A production dashboard should include verified automatic completion, review routing, false acceptance, retries and reconciliation, cost per start, and correct completion within the deadline.
Before release, define three stop conditions: what happens when verified success falls below target, who intervenes when the correction queue exceeds capacity, and which automation path is constrained when cost per start exceeds budget? Exercise these conditions with deliberate failure injection. How the system manages failure belongs in the design alongside its success rate.
TankDev's approach: measurable decisions and traceable systems
TAARM connects the success contract of a business process to system design. Database integrity, safe API integration, controlled automation retries, and AI output validation must work together. The objective is evidence that the customer's job completes correctly, traceably, and economically—not simply a higher calculator percentage.
To clarify the success contract and measurement plan for your workflow, contact us.